If you have just a little experience in project management, you should use the work breakdown structure (WBS) diagram to manage your projects efficiently. This beginner-friendly article will show you the key concepts, benefits, usages, and evaluation steps of the work breakdown structure with easy-to-understand examples.
What is Work Breakdown Structure (WBS)?
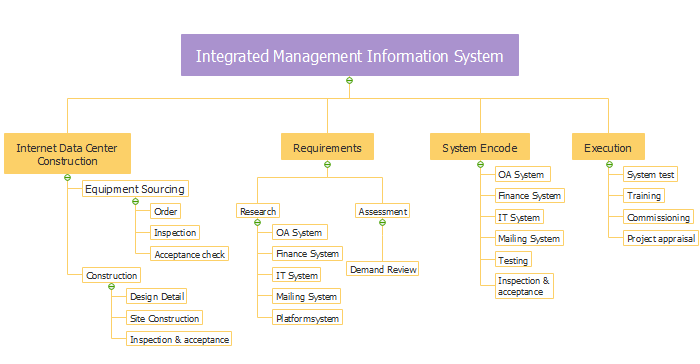
A Work Breakdown Structure generally breaks down the main project objective into smaller and manageable parts (work packages) for specific departments to produce their task with details including budget, required resources, and people who in charge of the task etc. Here deliverable means any verifiable and unique product or capacity to carry out a target service. A work package is a deliverable at the lowest level of a work breakdown structure used by team members to complete a specific task. For instance, the task of roofing is one of the work packages for constructing an office building. You can also think a work breakdown structure as an outline of your project. Here is a work breakdown structure example that shows the task details of an integrated management information system:
Work Breakdown Structure Brief History
The work breakdown structure theory originally came from the United States Department of Defense (DoD). Later in 1962, NASA and the aerospace industry introduced the work breakdown structure theory. Over the past several decades, the concept of WBS has been revised to be used in more general fields such as the aircraft sector, the electronics sector, the vehicle sector, the information sector, and the corporate business sectors.
Why Use the Work Breakdown Structure?
A well-crafted work breakdown structure can bring benefits not only to a specific project but also to your overall organization. More specific, using a work breakdown structure can help you:
- evaluate crucial details of your project, such as project scope, project cost, potential risk and so on.
- check out your project based on a top-level view so your team can easily decide a project timeline or schedule.
- facilitate team communication to make sure that every team member and stakeholder is on the same page throughout the project lifecycle.
- easily track your tasks progress, even for multi-projects at the same time. If your project is falling behind the original deadline, check out your work breakdown structure will help you easily spot the low-quality work package.
- quickly establish dependencies of your project visually.
- efficiently assign tasks and resources to your team members. In other words, the use of work breakdown structure would bring accountability to your team.
Although the work breakdown structure has the above advantages, it can’t be used as a replacement for your project plan or schedule based on a certain sequence. This could be the biggest pitfall of the work breakdown structure.
Who Uses Work Breakdown Structures?
The use of work breakdown structure can be applied in a wide range of areas including the following roles:
- Commercial Project Team members can be able to capture all the important pieces of their project in order to discuss with their vendors and governmental officers.
- Construction Project Leaders can use a work breakdown structure to track utility work and follow up with
- environmental approvals.
- Information Technology Engineers can use a work breakdown structure as a roadmap for their program development, for example, software development, remote projects, database system development and more.
- Event Planners can use a work breakdown structure to display all the details of subtasks to move forward.
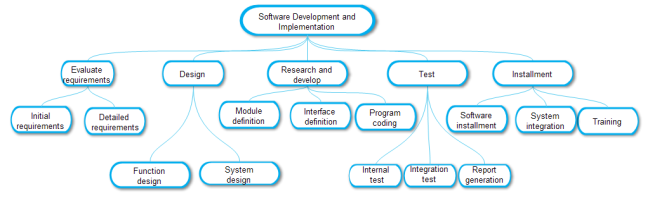
Here is a work breakdown structure example of software development and implementation. Feel free to click on it to see more details.
Work Breakdown Structure Formats
A work breakdown structure can be shown in a number of different formats including textual (a text outline with code numbers for each element), tabular tables with columns, graphical and organizational charts (tree structure). Among all of these types, the tree structure is the most common option which displays the hierarchy of work packages details with space for additional information. You should choose the correct format according to your project requirements.
Any Key Relationships between WBS and Typical Organizational Charts?
You may have already noticed that the work breakdown structure is quite similar to a traditional organizational chart. The key differences and common points of these two types of structure can be concluded as the following:
- Objective – WBS usually focuses on deliverables or measurable milestones, whereas typical organizational charts generally focus on employee titles and duties.
- Structure – The most common format of the work breakdown structure and traditional organizational charts are the hierarchical structure, which means each parent level has a number of child levels. However, in a matrix org chart or a flat org chart, links between staffs can be inter-crossed.
How to Conduct a Work Breakdown Structure Analysis?
The overall drawing process is simple. You can use a pencil, or a diagram software to help you do so. Here we will discuss the most productive way.
Step 1 – Team Communications
Gather your team members to find out the key aspects of your project from different points of views (project vision statement, project phases, project scope (any unexpected changes), stakeholders’ needs, task list with deliverables etc.). For deciding deliverables and work packages, you should:
- Define level one, level two and more for your projects.
- Calculate the percentage of each team member’s time for every stage of your project.
- Assign each deliverable to an independent team.
- Subdivide your project continuously until you think the components you defined are sufficient for your goal.
Step 2 – Decide Your WBS Format
You can choose different WBS formats, such as the text-based hierarchical structure with numbers and decimal points. Alternatively, you can use a table-based, or organizational chart.
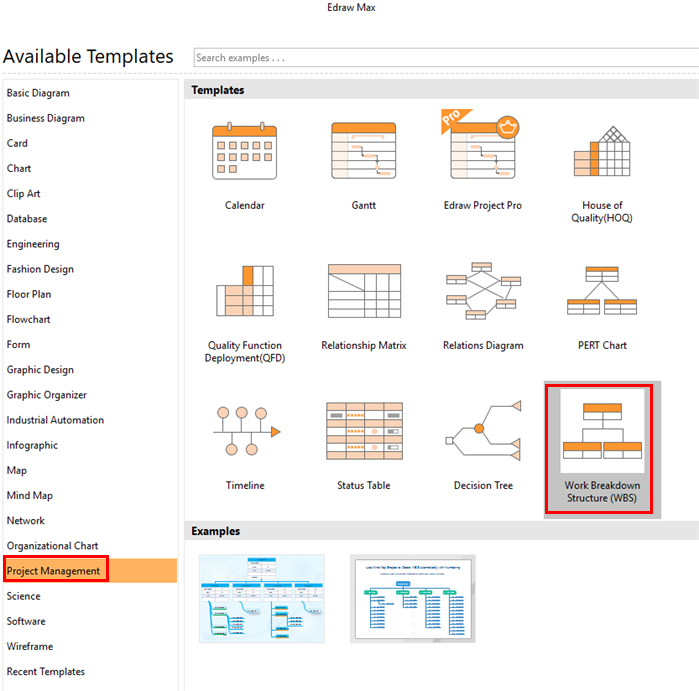
Step 3 – Start the WBS Diagram Software
Start Edraw Max and go to “Available Templates” – “Project Management” – “Work Breakdown Structure (WBS)”, double-click to open a new drawing page. Alternatively, you can select one of the preset templates for your work.
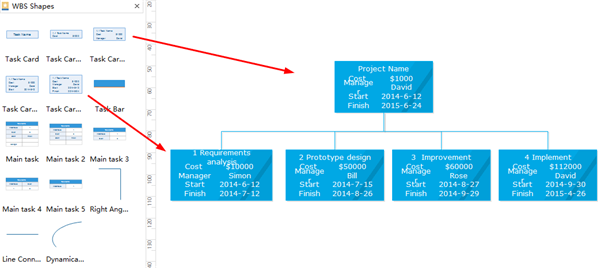
Step 4 – Structure Your Diagram with Task Details
Drag and drop one type of the preset “Task Card” options from the left-hand library to the right-hand canvas and fill in your task details. Then use the connectors to connect them in a logical way.
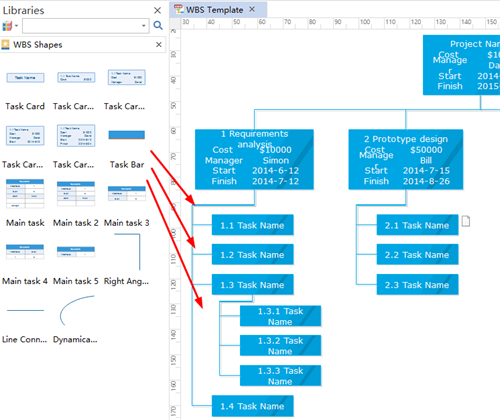
Step – 5 Break down Your Structure
Continuously breaking down your structure into more reasonable and measurable work packages depend on the type, size, and complexity of your project.
Final Step – Re-check Your Work
The final step is to ensure that all details are correctly applied to each work packages. You can also change the default theme of your work breakdown structure for a better visual presentation.
Read More:
What is Work Breakdown Structure (WBS) Diagram?