Simply read this comprehensive guide for all the key aspects (basic concepts, usages, benefits, types, how-to-create etc.) of knowing about the UML diagram with free download UML diagram templates.
What is a UML Diagram?
A UML diagram shows the unified visual presentation of the UML (Unified Modeling Language) system with the aim to let developers or business owners better understand, analyze and undertake the structure and behaviors of their system. To be more simple, such a diagram is very similar to blueprints used in construction building projects. So far, the UML diagram has become one of the most common business process modeling tools and is doing well for large and complex projects. UML is also highly significant to the development of object-oriented software with more clear and easy notations.
Why Use UML Diagrams?
UML diagramming has many benefits for both software developers and businessman, and the most key advantages are:
- Problem-Solving – Enterprises can improve their product quality and reduce cost especially for complex systems on a large scale. Some other real-life problems including physical distribution or security can be solved;
- Improve Productivity – By using the UML diagram, everyone in the team is on the same page and lots of time are saved down the line;
- Easy to Understand – Since different roles are interested in different aspects of the system, the UML diagram offers non-professional developers, for example, stakeholders, designers, or business researchers, a clear and expressive presentation of requirements, functions, and processes of their system.
What are the Types of UML Diagrams?
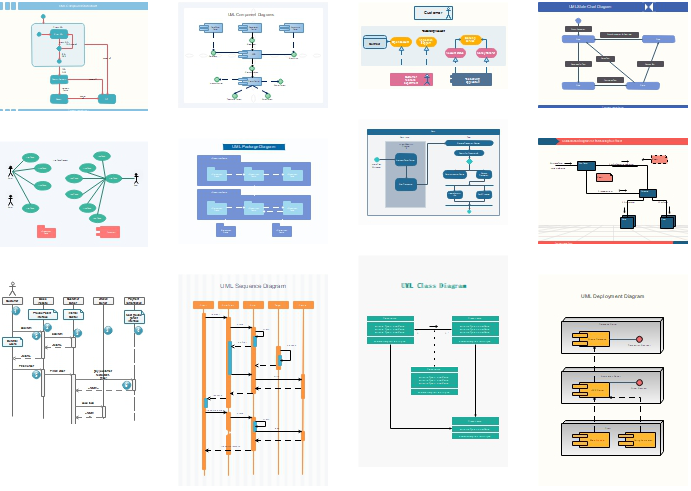
The two most main categories of UML diagrams are the Structure UML diagram and the Behavior UML diagram. Furthermore, 13 sub-types of UML diagrams are divided into these two groups and each one of them has a different purpose. Now let’s check out all of them in more details as shown below. You can also click on them to see more and download these examples for free.
Structure Diagrams
These diagrams show different objects and the static structure of the system. The elements in a structure diagram may include an abstract and some other related implementation concepts. This category has six sub-types:
- Class diagram
- Composite Structure diagram
- Object diagram
- Component diagram
- Deployment diagram
- Package diagram
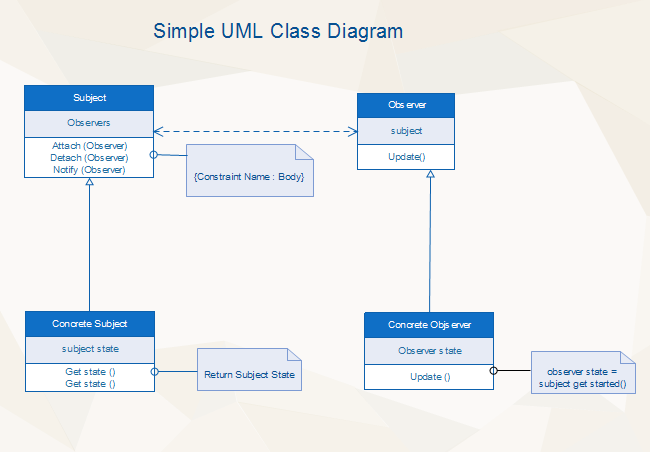
Class Diagram
It is the most widely used UML diagram sub-category. The Class diagram is the building block of all object-oriented software systems. Users can depict the static structure and identify classes relationship of a system by checking the system’s classes and attributes. Each class has three basic elements: the class name at the top, the class attributes in the middle, and the class behaviors at the bottom. In reality, you can create classes such as “Sales Account” or “Online User” in business systems, or “Teacher” and “Student” in academic systems.
Composite Structure Diagram
Composite structure diagrams are used to show the internal structure, the behaviors of classifiers, and the relationships between classes in a system. The composite structure type is similar to Class diagrams but the former ones represent more detailed individual parts rather than the whole system structure. Object Diagram
Object diagrams can be considered as the screenshot of the instances and their internal relationships in a specific system. By using such diagrams, developers can be able to analyze the operations of the system at a particular instant, and check their abstract structure. Furthermore, the relationship between a Class and an Object in software development can be described as the relationship between, for example, the class “Food” and the brand “KFC” or the general class “User” and a specific username called “David” or what else.
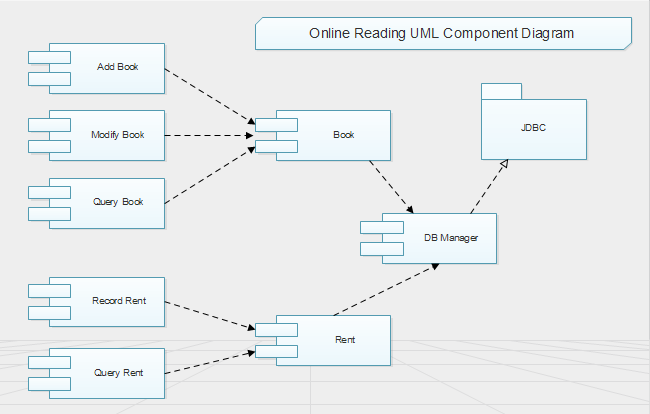
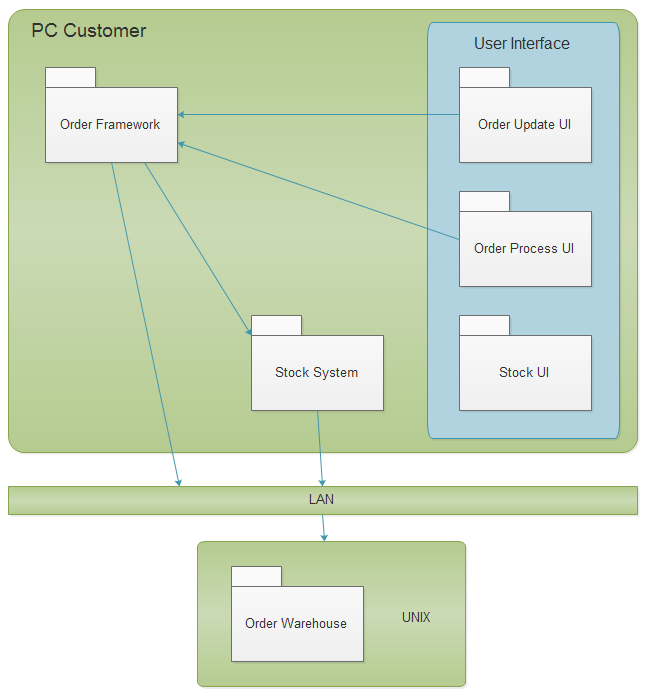
Component Diagram
Component diagrams are used to show in what way the physical components in a system is organized. Normally, developers use the Component Diagram to check out implementation details, break down the system into smaller parts, depict the structural relationship between system elements especially in the case of large-scale complex projects with more advanced technologies.
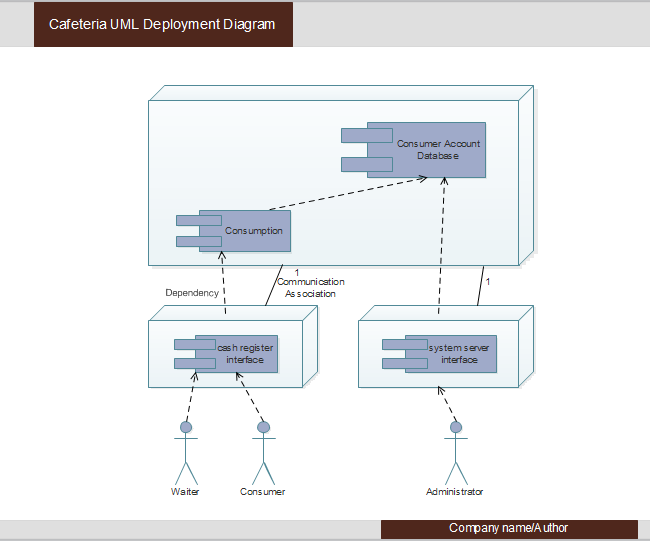
Deployment Diagram
Deployment diagrams are generally used to show users the visual relationship between software and hardware. A sample Deployment diagram in the software development field has two main parts: Nodes (basically different kinds of servers) and Artifacts (normally client or database schema). Nodes host the Artifacts, while different types of Artifacts operate on Nodes.
Package Diagram
In general, Package diagrams are used to depict how packages and their elements are organized into meaningful groups in a system. More specifically, Package diagrams can be considered as a structure that includes many deployment diagrams with nodes and artifacts. So far, package diagrams are used to organize the Class and Use Case diagrams.
Behavior Diagrams
These diagrams display the dynamic behaviors or in other words, what should happen in a system. For example, the way that objects interact with each other, or a set of changes to the system over a certain period. This category has seven sub-types:
- State Machine diagram
- Activity diagram
- Use Case diagram
- Sequence diagram
- Communication diagram
- Timing diagram
- Interaction Overview diagram
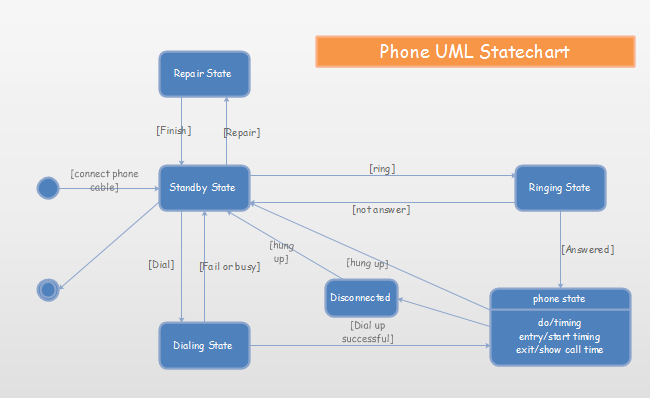
State Machine Diagrams (State Machines or State-chart Diagrams)
Such UML diagrams are used to represent the condition of the system, the dynamic action (different states) of a class in response to a particular time based on internal or external factors. A real-life example of the State Machine diagram could be playing Poker cards. The final result (different states) of the game can be different based on players’ specific strategies.
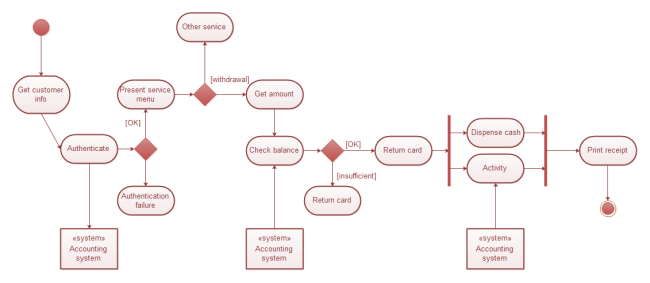
Activity Diagrams
Activity diagrams are used to illustrate the interconnected flow of different activities and actions (both in sequential form or in parallel type) in a system, and to display the steps involved in the execution of a use case. This type of UML diagram is widely used both in business modeling process and software development.
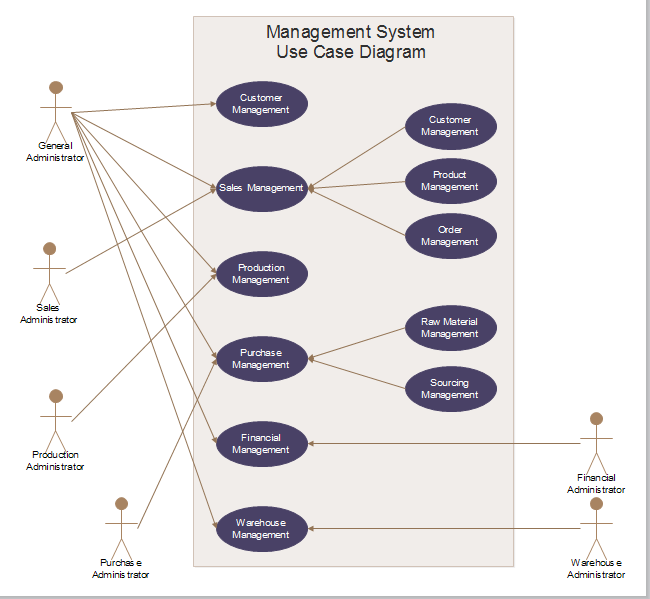
Use Case Diagrams
A Use Case diagram can be regarded as a good starting point for discussing project key actors and processes without going into too many implementation details. This UML diagrams is also the most popular type of the Behavioral UML diagram category and is used to analyze the functionality (the use cases) and the interactions with different types of agents (actors) of a system. For business cases, enterprises may use such diagrams to check out the customer order system by monitoring the stock, product quality and so on. For daily life cases, Use Case diagrams are similar to the Hot Sale product list of your local supermarket. You know the product name and its prices according to the list when making your purchasing decision.
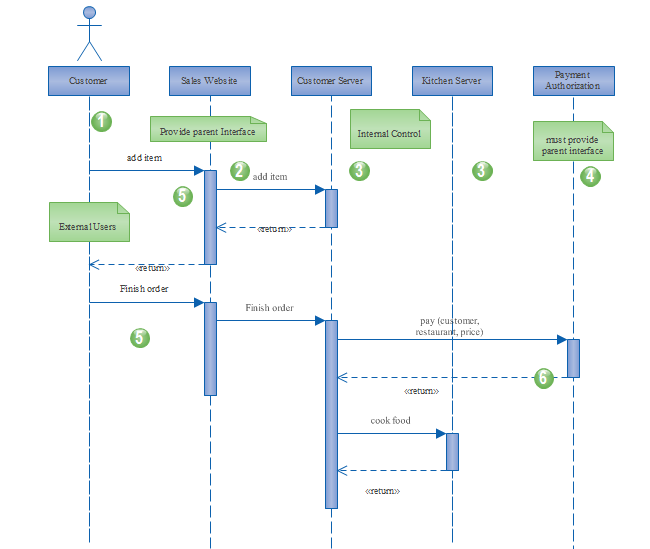
Sequence Diagram
A sequence diagram generally shows the interaction between objects in sequential order. It is for users to document and understand requirements in a new system. In software development, this type of diagram is used to represent the architecture of a system.
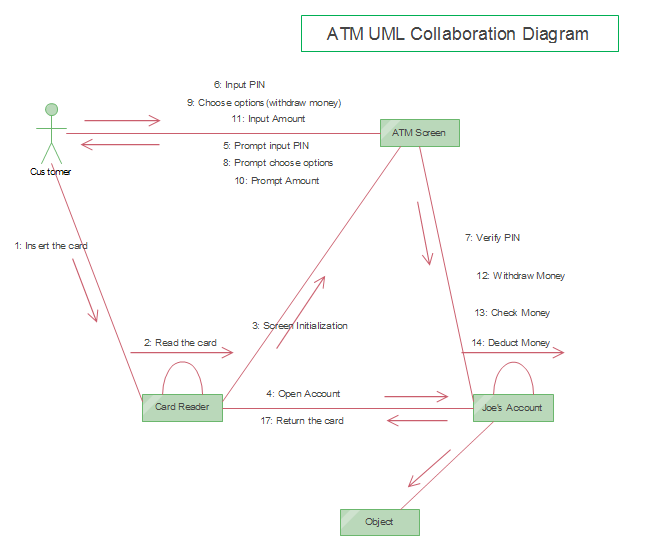
Communication Diagram (Collaboration Diagram)
A Communication diagram is used to display sequenced communications between objects with the focus on primary objects and their relationships. Communication diagrams usually use number schemes and pointing arrows to show message flow. Moreover, compared with sequence diagrams, communication diagrams are much easier to be designed but contains fewer details when drafting documentation for systems.
Read More:
What is a UML Diagram?