What is a decision tree? What are the advantages and limitations of the model? How could I easily create a decision tree diagram? Simply follow this article to explore more about the decision tree model with understandable examples and steps.
What is a Decision Tree?
A decision tree is a diagram used by decision-makers to determine action process or display statistical probability. It provides an effective and simple way for people to understand the potential choices of decision-making and the range of possible outcomes based on a series of problems. Decision trees usually start with a single node and then decompose into additional nodes to show more possibilities (such as choosing the two sides of a coin). The farthest branch on the tree represents the final result. Decision makers eventually weigh each action plan against the risks in order to make the final choice. Moreover, a tree can be created longer or shorter in length as needed.
Let’s Better Understand the Decision Tree Model with a Daily Example
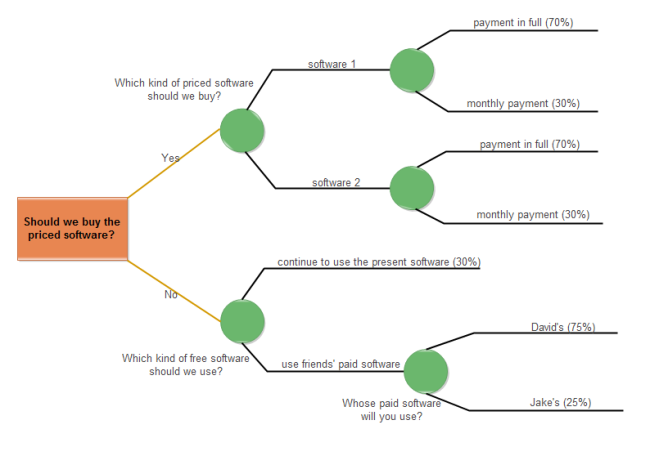
Here we gonna use a simple example to show you how the model works. Imagine that you want to try a new mind mapping software for your daily use. There are two options for you: to buy a paid software or just download the free software. For the paid pathway, you can choose either software brand 1 or 2, in full payment or monthly payment with corresponding possibilities (70% or 30% in our example here). However, if you want to save money, you may choose to use the present software, or use your friends’ paid software (here either David’s or Jake’s). If David is not busy then you may have more chances (here is 75%) to use his software. Feel free to click on the image to see more and feel download the original file to expand it based on your own needs.
What are the Advantages and Drawbacks of Decision Tree?
The decision tree model is quite useful mainly because of the following points:
- It is very easy to understand for all fields of users based on a good visual presentation.
- Building a decision tree requires only a small amount of data preparation, and the model does not require standardization of data.
- Both qualitative and quantitative data can be processed with the model.
- Large amounts of data can be processed in a specific period when using a decision tree.
- It can be easily used with other decision-making tools.
Although the model has many benefits to decision-makers, you should consider the following weak points:
- With the increase of branches, decision trees may contain too much-unwanted data. Therefore, users need to adjust the depth of the decision tree by setting the maximum amount of nodes or integrating different outcomes.
- Decision tree models may be unstable, which means small adjustments in a data set may lead to considerable changes in the final results.
How to Create and Analyze Your Decision Tree Diagram?
You can choose either create a decision tree diagram by hand or using an easy diagram software. No matter which way to choose, you should follow these steps 1,2 and 3 below. Here we are using an easy example to show you the overall process. You can try yourself for more complex cases based on this simple example here.
Step 1: Make Your Initial Decision
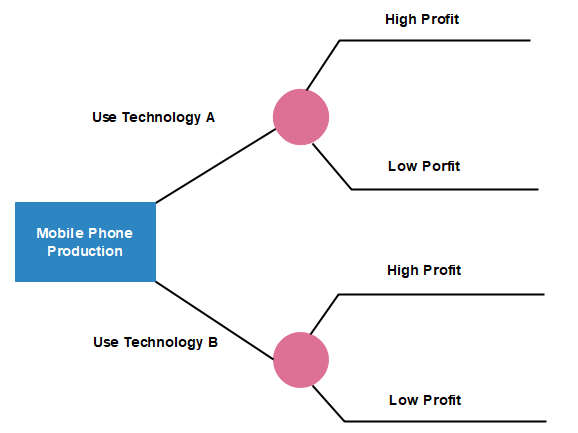
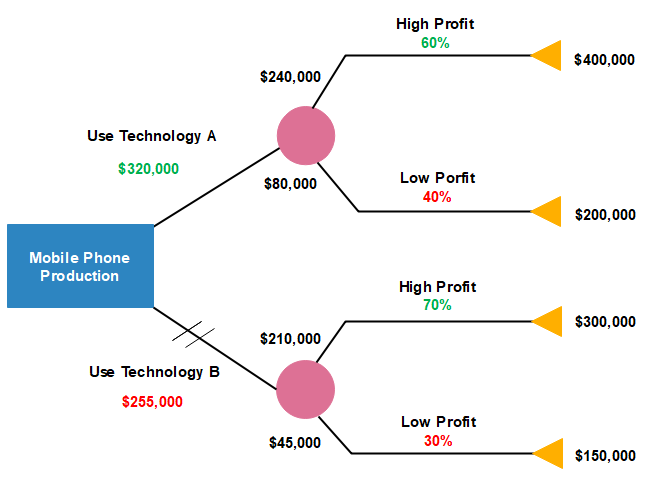
First, you must start with a specific decision for your diagram, for example, choose to use technology A or B for your new mobile phone production. Once decided, create a small square at the left side of your drawing canvas. Next, draw a number of lines from the square to the right side with labels for more possible outcomes. In our example here, you can add the outcome of high or low profit.
Step 2: Add Chance/Decision Nodes
Continuously expand your decision tree by inserting more decision nodes or chance nodes until every line reaches an endpoint (I.e. no more choices needed to be considered). Leave the space blank if the problem has been solved and add triangles to signify endpoints. Include the possibility of each result if you want to analyze options numerically.
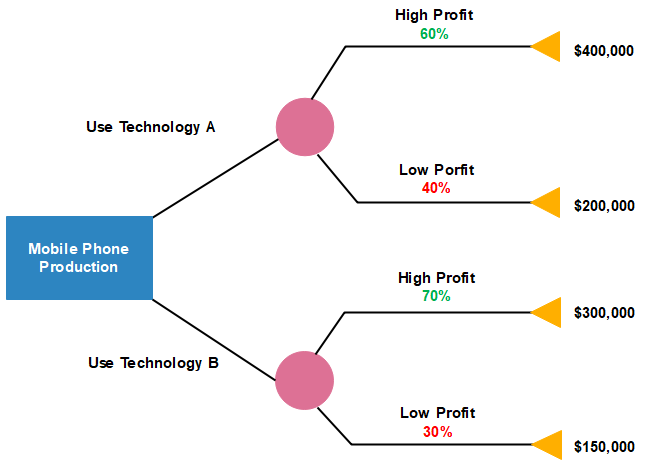
In our example above, the possibility of using technology A with a high-profit outcome is 60%, and %40 for the low-profit result. The possibility of using technology B with a high-profit outcome is 70%, and 30% for the low-profit result. You should also predict the most possible outcome for each of the endpoints, for instance, in our example, the outcome of a high profit after using technology A is $400,000.
Step 3: Evaluate Your Decision Tree
Now it’s time to analyze your decision tree. Simply multiplying the value of the results by their possibility. Then sum up the total value of each node from right to left on your decision tree diagram to compare and make the final decision. Here is our example, the calculation result is:
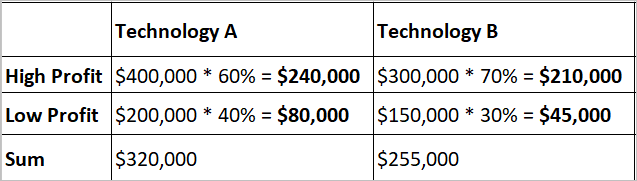
Since the sum of profit of option A ($320,000) is higher than that of option B ($255,000), so in theory, the company should use technology A as their final decision. Also, keep in mind that the risk preferences (low or high risk) of the decision maker may also lead to different final conclusion.
Read More:
What is a Decision Tree? – Easily Learn Key Points with Examples
