Venn diagram uses circles to represent sets, and its position and overlap of the circles indicate the relationships between the sets. Venn diagrams are commonly used in the teaching work in order to encourage students to recognize complex relationships between two or more things.
The Definition of a Venn Diagram
Venn diagram is an illustration that uses overlapping or non-overlapping circles to show the relationship between a finite collection of sets. Where the circles overlap, items have a specified something in common. Some even refer to Venn diagrams as the overlapping circle’s charts or double bubbles charts.

Venn diagram is an illustration of the relationships between and among sets, groups of objects that share something in common. Venn diagrams are a type of graphic organizer which consists of overlapping circles. It shows all possible logical relations.
Application of Venn Diagram
As most of you already know, with the help of Venn diagrams, you can arrange all your abstract ideas easily. They’re excellent when it comes to making comparisons between groups of things. Venn diagrams are usually used for solving math problems which demand logical thinking and deductive reasoning, thus Venn diagrams act as an important tool in K-12 Education.
Venn diagrams show relationships, clarify concepts, and facilitate communication. Venn diagrams do not just restrict its use to classroom learning, but also used extensively in other disciplines. It’s a great tool for organizing, evaluating and representing complex relationships visually.
Let us see how to use a Venn diagram to solve a math problem. Of the people in Lily’s neighborhood, 4 have been to New York. 6 people have been to Los Angeles. 2 people have been to both New York and Los Angeles. How many people have been to New York but not Los Angeles?

Brief History of Venn Diagram
Venn diagram gets its name from British mathematician, John Venn, who introduced the illustration. In 1880, Cambridge fellow John Venn presented his paper “On the Diagrammatic and Mechanical Representation of Propositions and Reasonings.” This work ultimately secured his position as the namesake of Venn diagrams. Venn’s body of work includes his 1881 treatise “Symbolic Logic” as well as “The Principles of Empirical Logic,” which he wrote in 1889.

The first use of the term Venn diagram did not occur until many years after Venn delivered his paper. The term “Venn diagram” appears in “A Survey of Symbolic Logic” by Clarence Irving Lewis, published in 1918.
You can view a brief Venn diagram guide through slides. Click here to download the ppt template of Venn Diagram Guide.
Examples of Venn Diagram
A Venn diagram uses intersecting circles to illustrate the similarities, differences, and relationships between groups. Similarities between groups are represented in the intersecting portions of the circles, while differences are represented in the non-intersecting portions of the circles.

Steps to Make a Venn Diagram
Although it is convenient to use Venn diagrams to clarify things, drawing Venn diagrams by hand is not that easy. No worries, you can quickly and correctly draw a Venn diagram with the help of Venn diagram maker. Let me show you how to use a Venn diagram maker to draw a Venn diagram.
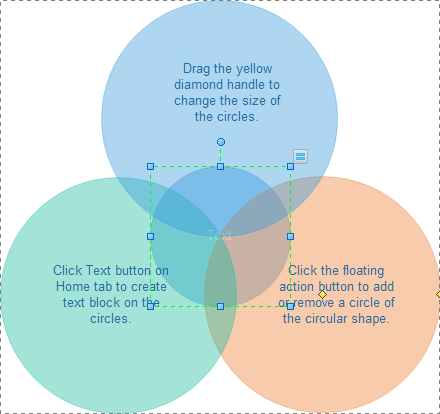
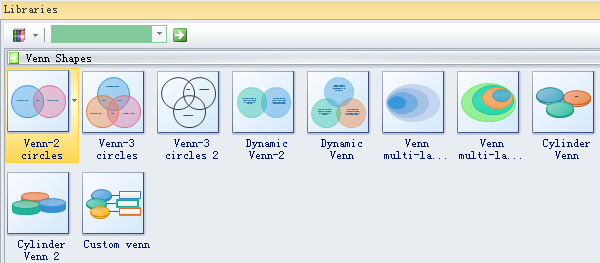
First things first, you need to choose a Venn diagram shape you like from the library which is on the left of the canvas.
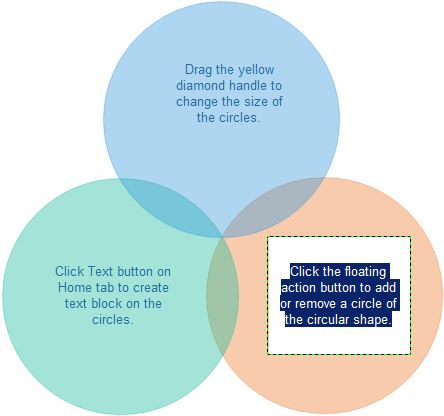
Drag and drop the Venn diagram shape you have chosen on the drawing page. Double click each circle to edit the text in the Venn diagram.
If you want to delete or add a circle, please find the floating button which is around the bottom of the top circle.
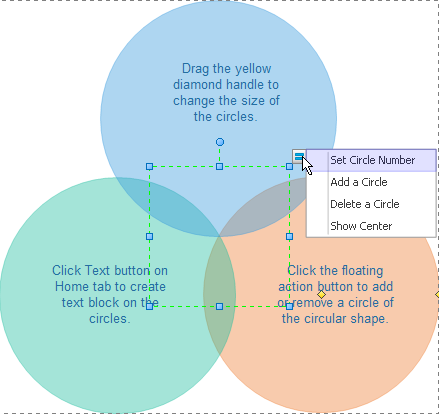
When you choose “Show Center” option, the center circle will appear like the picture below shows.