Venn Chart is a helpful tool to solve math problems which require logical thinking and deductive reasoning. Below is a detailed explanation on how to work out math problems with Venn charts.
Question 1
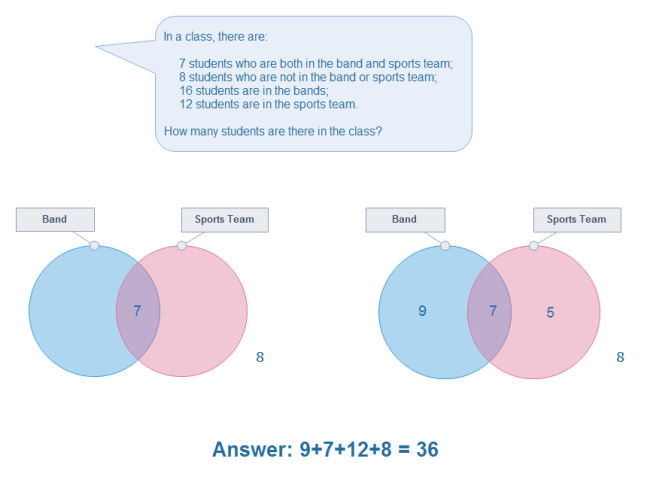
In a class, there are 7 students who are both in the band and sports team; 8 students who are not in the band or sports team; 16 students are in the bands, and 19 students are in the sports team. How many students are there in the class?
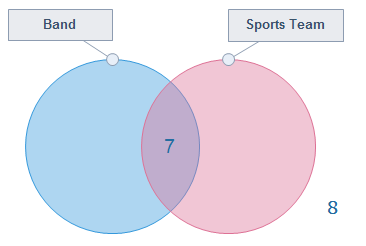
First, let’s draw a Venn diagram to show the numbers in the band or in the sports team. We can put in the numbers for the first two facts straight away, as seen on the left. The 7 students who attend both band and sports team go in the intersection because they need to be in both circles. The 8 students who don’t belong to any group go on the outside because they shouldn’t be in either circle.
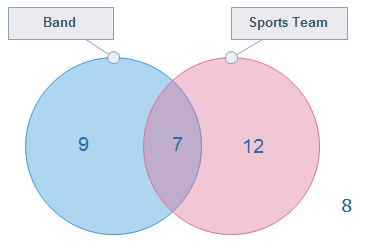
Let’s look at the other two facts. There are 16 students who go to band, so the numbers in the band circle should add up to 16. We already have 7 in the intersection, so there must be 9 who go to the band but not a sports team. In the same way, there are 19 students who go to sports team so the number must be 19 – 7 = 12. To find out the number of students in the class we add up all the sections: 9 + 7 + 12 + 8 = 36
Question 2
In a class of 50 students, 16 take Dance Class; 19 take Golf; 5 take both Dance Class and Golf. How many students in the class are not enrolled in either Dance Class or Golf?
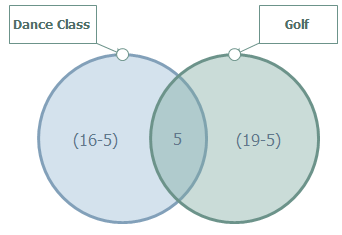
We can draw a Venn diagram to show the numbers who take a dance class and who take golf. But this time we can only put in one fact straight away. 5 students take both Dance Class and Golf, so let’s put the intersection with 5. There are 16 in total who take a dance class, minus the intersection number 5, so the left section should be 16-5=9. In the same way, the right section should be 19-5=14
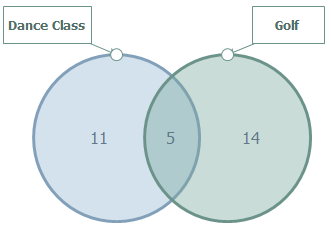
Now we know the total number of students in class is 50, and students who take both dance and golf class are 11+5+14=30 So for students who are not enrolled in either Dance Class or Golf should be 50-30=20
More Questions
On the worksheet below are more questions for practice, click the picture to download this worksheet. 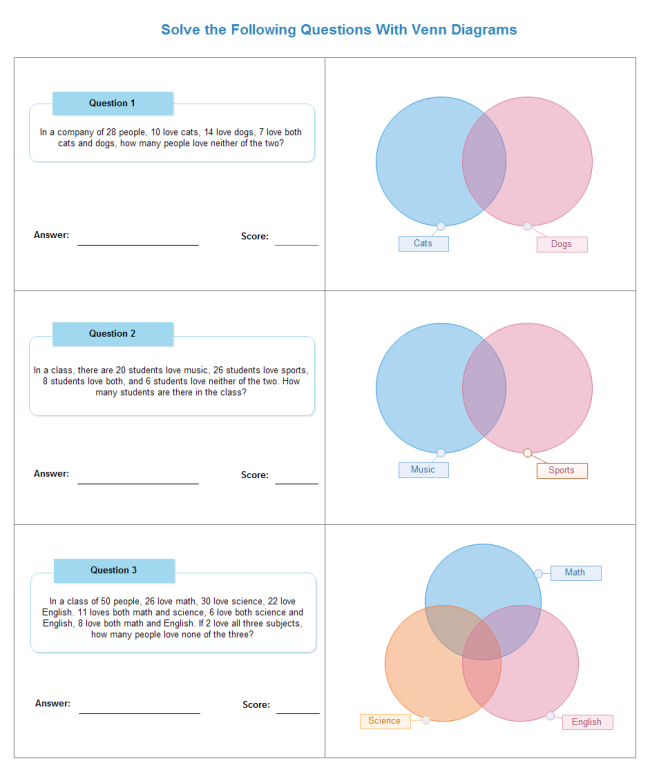
Learn More:
Use Venn Chart to Solve Math Problems